PRESS / PUBLICATIONS
Data and Art -
On Data and Design
Episode #25
Our panel of experts will explore the latest projects that combine data visualization, data art, sculpture, and sensory experiences. The overarching question will guide us, «Where does design end and art begin?
Moderated by Darjan Hill from Superdot
MAKING DATA
Materialising Digital Information
Edited by Ian Gwilt
Bloomsbury Visual Arts, London
About Making Data
Making Data delivers the importance and likely future prevalence of physical representations of data. It explores the creative methods, processes, theories and cultural histories of making physical representations of information and proposes that the making of data into physical objects is the next important development in the data visualisation phenomenon.
Part One: Theories
1. Data Objects Thinking With Your Hands, Adrien Segal (USA)
Pittsburgh Magazine
October 2023 Issue
"Four Artists Are Turning Data and Reaction to the Global Crisis into Works of Art"
By Emma Malinak
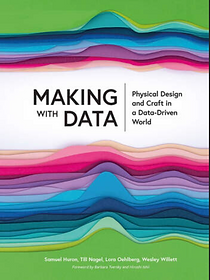
Making With Data
Physical Design and Craft in a Data-Driven World.
Edited By Samuel Huron, Till Nagel, Lora Oehlberg,
Wesley Willett. Routledge’s CRC Press.
Convergence II
The Art Collection of the National Academy of Sciences (2021)
The National Academies Press, Washington D.C.
Science relies on the rational. Art celebrates the intuitive. Together they inform one another.
This catalog contains beautiful reproductions of more than 30 original artworks from the National Academy of Sciences collection.
RUMINATE MAGAZINE
At Sea
Issue 60 / Fall 2021
The writers and artists whose work makes up Ruminate issue 60 probe the imagery and metaphor of being at sea.
Force Majeure: Wildfire and Wheat
Exhibition Catalogue
Cultural Programs of the National Academy of Sciences
Introduction by Juliana Biondo

Visualizing and Physicalizing Agriculture
The Data Physicalization Lab at the University of Lethbridge invited six artists to participate in a residency, documentary film, and exhibition that asked them to respond to agricultural data developed by Dr. Jamie Larson and Dr. Andre Laroche from the Lethbridge Research and Development Centre.
Video by Bryn Hewko, Output Media
Feature Story |Oct 13, 2022
"Processing the Trauma of Wildfires Through Art"
By Rhea Nayyar
Volume VI: Adjustments and Accommodations
Foreword by Severine Von Tscharner Fleming.
Greenhorns.
A Deep Curiosity about the World
Feature Story | July 13, 2020
Oceanographer Jody Deming and sculptor Adrien Segal explore how science and art connect
By Sara Frueh
An Emotional Response to the Value of Visualization
Y. Wang, A. Segal, et al., IEEE Computer Graphics and Applications
Volume: 39 , Issue: 5 , Sept.-Oct. 1 2019
Open Form: Facebook Artists in Residence 2012 - 2017
Introductions by Drew Bennett, Mark Zuckerberg. September 2017.

"Plot Lines." By Deborah Bishop. June / July 2017.
"The New Makers: Uniting Science and Art".
By Denise Burrell-Stinson, Photos by Mark Mahaney
April 5, 2015.
ARID: A Journal of Desert Art, Design, and Ecology
"Snow Water Equivalent - Data as Sculpture." Fall 2015.
Homer News
"From Science to Sculpture". By Michael Armstrong. May 2014.
"Holding Water". University of Washington Press, Summer 2013.
Scientific American: Symbiartic
The Science of Art and the Art of Science. September 18, 2013.
Boom: A Journal of California
University of California Press. Spring 2012.
Data Flow 2: Visualizing Information in Graphic Design
Die Gestalten Verlag GmbH & Co. KG. Berlin, Germany. 2010.


500 Tables: Inspiring Interpretations of Function and Style
Lark Books. Sterling Publishing Co., Inc. New York, NY. 2009.


